How to Estimate Retirement Savings with Compound Growth
Project retirement savings using monthly compound growth formulas, hypothetical scenarios, fees and purchasing-power adjustments.
Quick answer: Choose a starting balance, a regular contribution, the number of months until your target date and a hypothetical net annual return. When compounding and deposits are monthly, use a monthly-rate future-value formula or a trusted calculator. Then model at least a low, middle and high outcome, subtract inflation for purchasing-power context, and treat the results as illustrations—not promised investment returns.
What you will finish: A transparent long-horizon savings projection, an estimate of how much you personally contribute, a comparison of hypothetical growth scenarios and a money-in-today’s-terms illustration. This is a math guide, not an investment recommendation or retirement-readiness assessment.
Gather your assumptions and identify their limitations
Write down the amount already saved, your expected contribution, starting date, years to retirement and contribution schedule. Choose one currency. Separate fixed deposits from investments whose value may rise or fall. Decide whether a stated rate is nominal, real after inflation, before fees or after fees. A rate with undefined treatment of fees and inflation is an unreliable forecast.
This article uses end-of-month contributions, a constant monthly rate calculated from an assumed nominal annual rate divided by 12, no taxes, no withdrawals, no fees unless the selected assumption already accounts for them, and a constant inflation assumption. Real-life markets have volatile yearly returns; using one steady monthly number is a simplification. For a savings account, quoted APY/AER is an effective annual measure and must be converted appropriately—it should not automatically be divided by 12 as though it were a nominal APR.
Step-by-step projection
Step 1 — Set the balance, deposit schedule and date range
For our entirely fictitious illustration, suppose you already have $5,000 and contribute $250 at the end of each month for 25 years, meaning 300 monthly deposits. The personal contributions across that period are $250 × 300 = $75,000; total deposited principal including starting money is $80,000. This is not a suggested starting balance or deposit amount.
Mark whether deposits arrive at the beginning or end of the month. That detail changes the formula. If you stop saving for a year, the full-deposit model overstates future contributions and possibly growth.
Step 2 — Choose a consistent hypothetical net return
Make three purely assumed scenarios: 3%, 5% and 7% nominal per year. The numbers are not historical averages, recommended investment returns or official forecasts. Use one annual-rate convention throughout this example: the annual number is a nominal annual rate compounded monthly, so monthly interest is annual rate ÷ 12. If you are studying a real product with disclosed APY, or investing with fees, convert and adjust the inputs appropriately. A constant positive return is not a representation of market behavior.
Step 3 — Use the correct formula for end-of-month deposits
With starting balance P, monthly deposit C, monthly rate i and months n:
FV = P × (1 + i)^n + C × [((1 + i)^n − 1) ÷ i], when i is nonzero. If i = 0, use FV = P + C × n. The first expression compounds the initial balance; the second compounds the individual end-of-month payments. With a beginning-of-month deposit, the contribution term would be multiplied by (1 + i), all else held equal.
For the middle illustrative 5% case, i = 0.05 ÷ 12, n = 300, P = $5,000, C = $250. Using high-precision calculation and rounding only the final displayed answer gives $166,283.88. Of that, $80,000 is assumed deposited principal and $86,283.88 is arithmetic projected growth. The growth is not assured or earned yet.
Step 4 — Run several outcomes instead of using a single target value
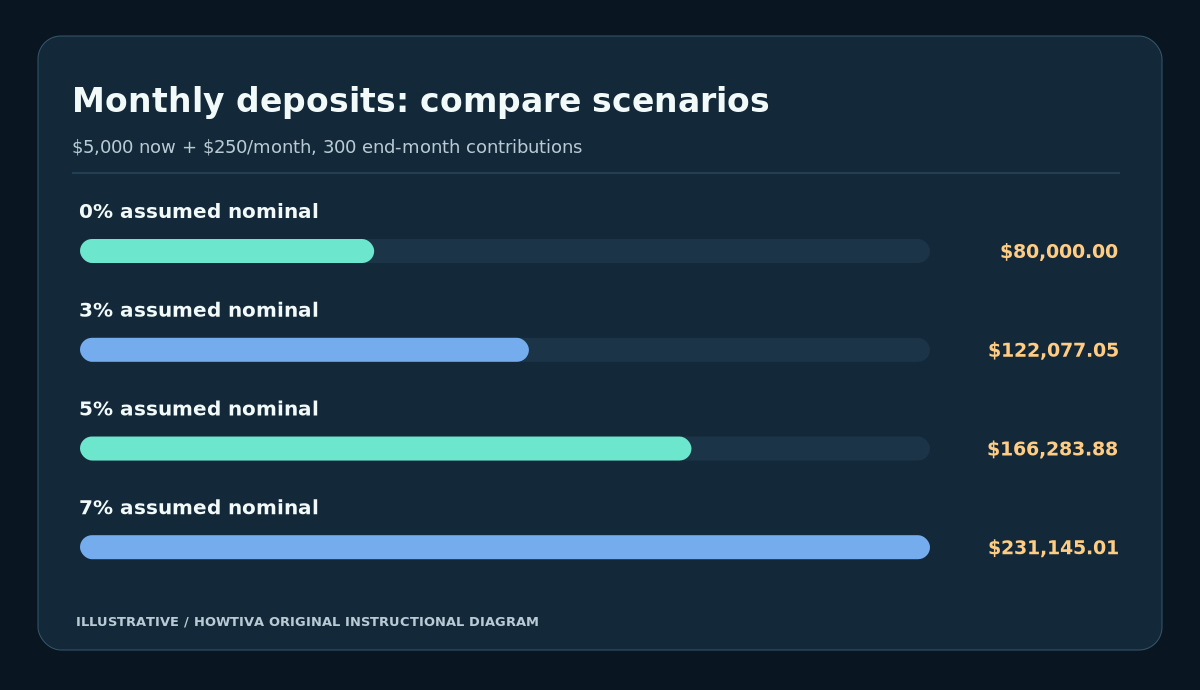
Under the same monthly-deposit assumptions, 3% yields $122,077.05, 5% yields $166,283.88, and 7% yields $231,145.01 after 25 years. At 0%, the balance would simply be $80,000. Small rate differences compounded over long time horizons create large endpoint differences. They do not describe a probability distribution—three scenarios are not a measure of what is most likely.
If contributions are invested in risky assets, losses are possible, including a balance below your total contributions. If a provider charges fees, model the effect explicitly; the SEC emphasizes that fees reduce the amount available to compound.
Step 5 — Convert the nominal total to today’s purchasing power
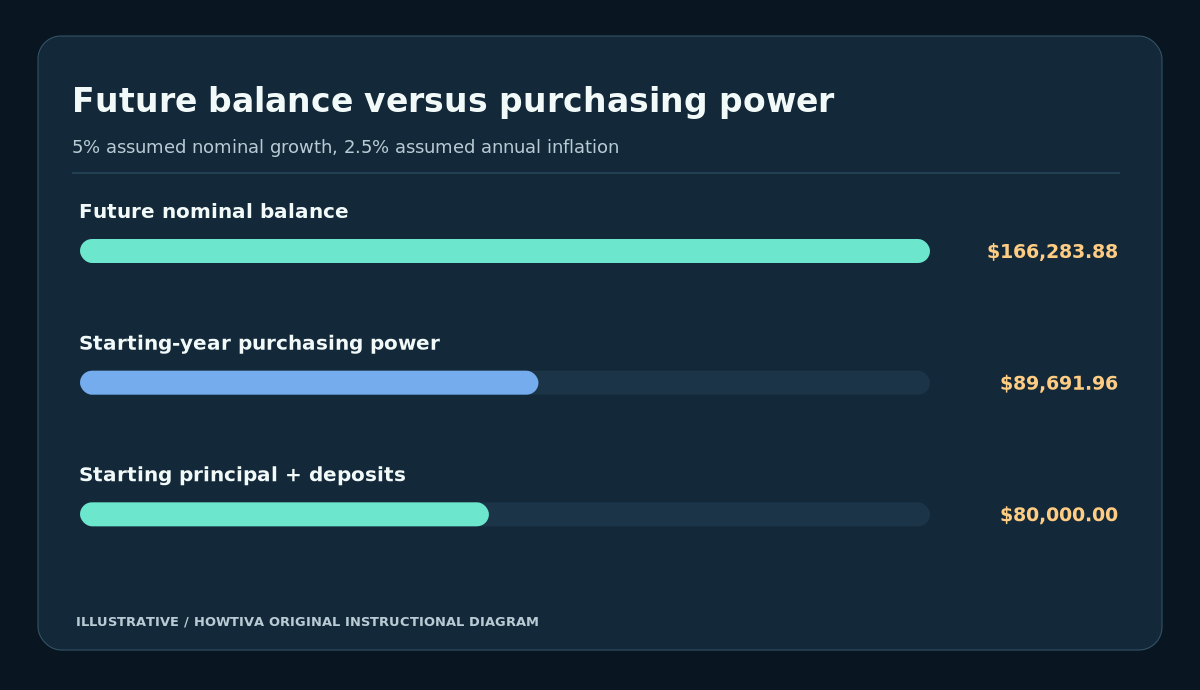
If, purely for illustration, inflation averages 2.5% annually for the next 25 years, then a future amount F has today’s-money equivalent of F ÷ (1.025)^25. For the 5% projection, $166,283.88 ÷ (1.025)^25 ≈ $89,691.96 in starting-year dollars. This is a deflation calculation using an assumed 2.5% annual rate, not an observed or forecast inflation statistic.
Real purchasing power also depends on future taxes, withdrawal behavior and changes in spending. Do not compare today’s costs to future nominal balances without accounting for inflation.
Step 6 — Test affordability and changes in contribution
Ask whether $250 is practical in months with large expenses. Test another deposit or start date instead of inflating the return assumption to force a target. For example, a person able to add only $100/month should enter $100 and rerun the formula. If you expect income to increase over time, model a schedule of changing contributions rather than pretending every deposit was the future higher amount.
A missed contribution changes both principal and potential compounding. If you expect periodic salary gaps or large one-time expenses, a year-by-year cash-flow approach is more realistic than a single constant annuity formula. The general principle is to use inputs you can explain and afford, not attractive numbers with no plan behind them.
Step 7 — Incorporate charges, taxes and plan rules
For investments, fees may include management, administration, transaction or advice costs; where the assumption is already a net return, avoid subtracting the same charge again. Retirement accounts also vary by country in tax treatment, withdrawal rules, employer matching, contribution limits and minimum ages. These regulations can change. Use current documents for an actual retirement plan; our model deliberately claims no 2026 tax limits or guaranteed yields.
Step 8 — Compare the arithmetic with an independent calculator
The US SEC’s Investor.gov compound-interest calculator accepts initial balance, monthly contributions, years, estimated interest rate and compounding frequency. Enter the same rate convention and end-of-month timing before comparing results; calculators may implement different conventions or round at each step. If your answer differs, compare timing first, then rate type (APR versus APY), fees, deposits and rounding.
Complete worked scenario (illustrative only)
| Input / outcome | Amount |
|---|---|
| Starting amount | $5,000 |
| Deposits | $250 × 300 months |
| Total amount deposited | $80,000 |
| FV at 0% | $80,000.00 |
| FV at assumed 3% nominal | $122,077.05 |
| FV at assumed 5% nominal | $166,283.88 |
| FV at assumed 7% nominal | $231,145.01 |
| 5% scenario: difference above deposits | $86,283.88 |
| 5% scenario in starting-year money, 2.5% assumed inflation | $89,691.96 |
These are projections with simplified constant inputs, not published rates, retirement products or promises of return.
Common mistakes and troubleshooting
Mixing APY and APR: An effective annual yield already includes compounding; use the appropriate conversion and do not divide it by 12 blindly.
Counting contributions as earnings: Subtract your starting principal and all deposits from the projected future value before describing any difference as projected growth.
Using future dollars as if they had today’s purchasing power: Deflate the future balance using an explicitly chosen inflation assumption.
Forgetting fees and taxes: Small fee differences matter over time. Compare total cost disclosures and note tax consequences separately.
Treating a steady positive rate as certain: Actual markets move irregularly; an annualized arithmetic illustration can conceal loss and sequence risk. Consider a conservative scenario, no-growth case or professional retirement cash-flow review.
Getting a surprisingly high answer: Check whether contributions are monthly but periods entered as years, whether the annual rate was typed as 5 instead of 0.05 in a spreadsheet, and whether the formula assumes deposits at month-start.
Alternatives and exceptions
For cash savings, use account disclosures and effective-yield calculations; a separate emergency reserve should be considered for near-term liquidity. For investing, a simulation using variable returns may be more informative than a constant-rate compound model, but it still does not guarantee a result. Employer matching, defined-benefit pensions, social insurance and mandatory workplace saving change the picture significantly; these are outside this basic mathematical calculator.
Country notes: US retirement tax-advantaged accounts, UK pensions and ISAs, Canadian RRSPs/TFSAs and Australian superannuation have different eligibility and tax rules; do not swap their limits or model every account as a tax-free investment. Specific current limits should be checked in the appropriate official scheme guidance rather than guessed from this formula.
Frequently asked questions
Is a 7% annual return a safe assumption?
No fixed return is universally safe or assured. In this guide 7% is one fictional math scenario, not a prediction about any market or account.
Do I use average market return or the rate advertised by my bank?
Define exactly what the quoted number means and whether it includes compounding, fees and tax. It is not valid to treat nominal rates and effective yields as identical.
What if I contribute at the start of every month?
The deposit portion earns one additional monthly period in this mathematical convention; multiply that portion of the end-of-month formula by (1 + i). Keep the starting balance convention unchanged.
What if the rate is zero or negative?
For zero, use P + C × n. For negative monthly rates the formula still has a mathematical interpretation if (1 + i) is valid, but actual investment losses and contribution timing may require a month-by-month model.
Is the balance enough to retire?
This calculation cannot answer that. Retirement income needs depend on spending, inflation, taxes, health, pension or social benefits, lifespan and withdrawal strategies; there is no single universal sufficient number.
Final projection checklist
- [ ] Initial balance, contribution amount and number of deposits are stated.
- [ ] Start/end-of-month deposit timing is explicit.
- [ ] Nominal versus effective versus real rate is identified.
- [ ] At least three reasonable assumed, not promised, scenarios are shown.
- [ ] Total personal deposits and projected growth are separated.
- [ ] Fees, taxes, withdrawal limits and purchasing power are considered.
- [ ] Results are independently recalculated with matching assumptions.
Sources & Further Reading
- US SEC / Investor.gov: Compound Interest Calculator
- US SEC / Investor.gov: How Fees and Expenses Affect Your Investment Portfolio (2025)
- US SEC / Investor.gov: Understanding Fees
Official source materials checked 27 October 2026. Every stated rate and balance in the examples is hypothetical. This guide provides arithmetic education, not personalized investment or tax advice.
Use the checklists as you go, and confirm the result before moving on to a more involved repair.